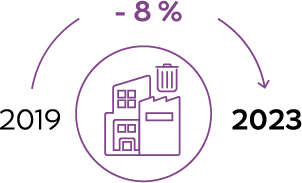
GENERATION OF TRANSPORTABLE WASTE FROM INDUSTRIAL SITES

(in grams per finished product, excluding sludge and returnable packaging in rotation, including returnable packaging at source)
GENERATION OF TRANSPORTABLE WASTE BY ADMINISTRATIVE SITES AND RESEARCH CENTRES

(kilograms per 100 hours worked, excluding sludge and returnable packaging in rotation, including returnable packaging at source)
GENERATION OF TRANSPORTABLE WASTE GROUP-WIDE

(in grams per finished product, excluding sludge and returnable packaging in rotation,including returnable packaging at source)

Tracking of transportable waste
In addition to tracking of waste by type, an approach to account for waste by cause has been used since 2019 at all the Group’s factories and distribution centres. This method identifies and quantifies the sources and causes of waste generation in the flows of a site. This approach strengthens the action plans to reduce waste and is an additional vector of progress for the sites.
At each Group site, specific tracking (volumetry, collection streams, treatments etc.) of hazardous waste is implemented under local regulations (flammable, toxic etc.). This tracking takes into consideration the specific characteristics of each country in which the sites operate. Like other waste, hazardous waste management benefits from a continuous improvement process which has allowed wastewater to be reclassified as hazardous waste to improve the way it is treated.
| Hazardous waste(1)Data restated according to the rules specified in the methodological notes (see paragraph 4.5.1.3). (tonnes) | 2021 | 2022 | 2023 | Variation vs. 2022 |
|---|---|---|---|---|
| L’Oréal Group | L’Oréal Group202119,815 | L’Oréal Group202222,871 | L’Oréal Group202322,526 | L’Oréal GroupVariation vs. 2022-2% |
| Industrial sites | Industrial sites 202119,200 |
Industrial sites 202222,357 |
Industrial sites 202322,019 |
Industrial sites Variation vs. 2022-2% |
| Administrative sites and research centres | Administrative sites and research centres 2021615 |
Administrative sites and research centres 2022514 |
Administrative sites and research centres 2023507 |
Administrative sites and research centres Variation vs. 2022-1% |
