
Aligning greenhouse gas emissions with the GHG Protocol
The Group calculates and monitors the greenhouse gas (GHG) emissions linked to all its activities according to the GHG Protocol. These emissions are defined as follows:
- Scope 1 emissions: direct GHG emissions from sources controlled or held by the Group. This includes the consumption of gas and fuel oil across all operated sites (factories, distribution centres, administrative sites, research centres) and operated stores. Estimated figures are also included for any other facilities with fewer than 50 permanent administrative staff. Emissions associated with any cooling gas leaks are included. The emissions associated with the use of fuel by the Group’s vehicle fleet are also included;
- Scope 2 emissions: indirect GHG emissions linked to electricity, heating, cooling and steam purchased across all operated sites (factories, distribution centres, administrative sites, research centres) and operated stores. Estimated figures are also included for any other facilities with fewer than 50 permanent employees. The emissions associated with the electricity consumed by the Group’s vehicle fleet are also included; and
- Scope 3 emissions: other indirect GHG emissions linked in particular to the product supply chain (upstream emissions) and the use of products and services during their life cycle (downstream emissions)(1).See subparagraph 4.3.1.4.1. GHG assessment: an annual exercise, Scope 3 – emissions estimated annually.
CO2 emissions – Scopes 1 and 2 for operated sites(2)
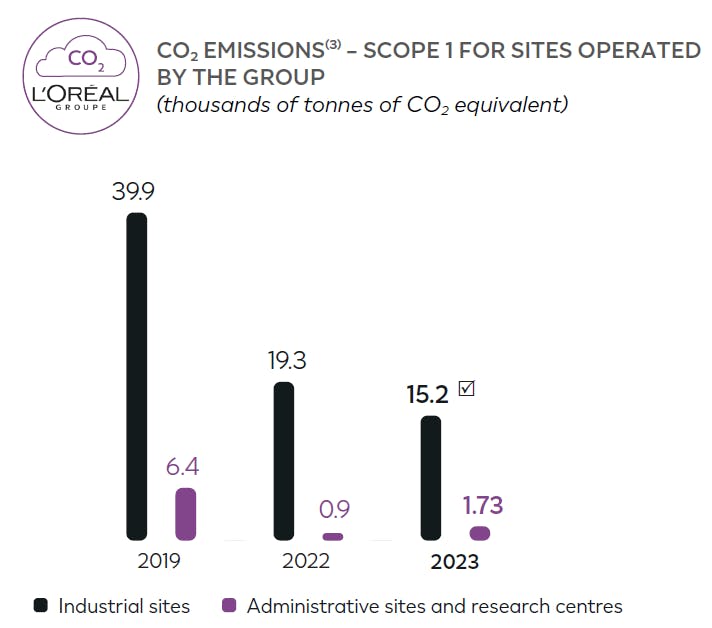
1- This graph indicates the CO2 emissions(3)Data restated according to the rules specified in the methodological notes (see paragraph 4.5.1.3). - Scope 1 for sites operated by the group in thousands of tonnes of CO2 equivalent).
Industrial sites
- 2019: 39.9
- 2022: 19.3
- 2023: 15.2
Administrative sites and research centres
- 2019: 6.4
- 2022: 0.9
- 2023: 1.73
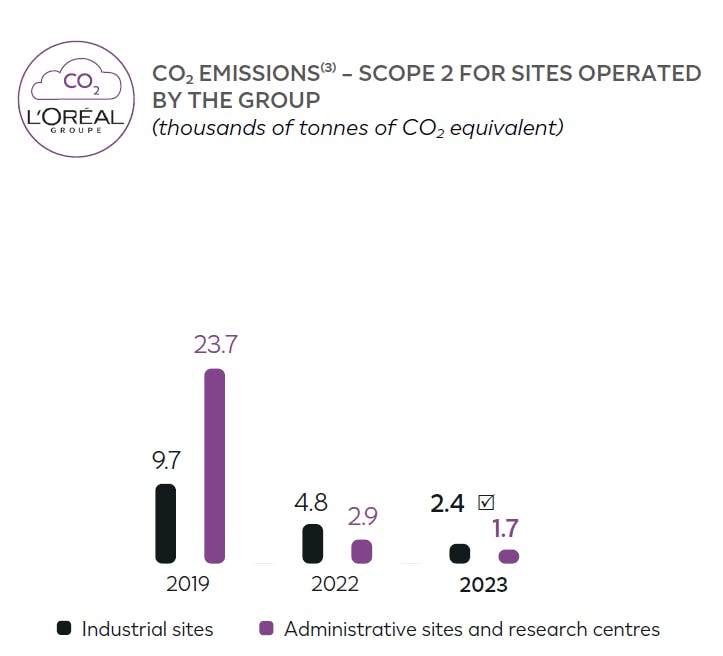
2- This graph indicates the CO2 emissions (4) Scope 2 for sites operated by the group in thousands of tonnes of CO2 equivalent.
Industrial sites
- 2019: 9.7
- 2022: 4.8
- 2023: 2.4
Administrative sites and research centres
- 2019: 23.7
- 2022: 2.9
- 2023: 1.7
In 2023, CO2 emissions of operated sites decreased by 74% compared with 2019, while production increased by 12% compared with 2019. CO2 emissions from industrial sites decreased by 65%.
In 2023, CO2 emissions of administrative sites and research centres decreased by 89% compared with 2019, while hours worked on site decreased by 27% compared with 2019.
This reduction at administrative sites and research centres was achieved thanks to the decrease in energy consumption since 2019 and the increased use of renewable energy for a large number of sites. Indeed, energy consumption was down 17% from 2019, and the share of renewable energy rose to 94% The Statutory Auditors have expressed reasonable assurance about this indicator.(compared with 51% in 2019). The widespread use of remote working also had a beneficial impact on this result, thanks to the reduced presence of teams on site.
Comprehensive Scope 1 & 2 emissions data, including the emissions of the vehicle fleet and operated stores, can be found in subparagraph 4.3.1.4.1.
☑The Statutory Auditors have expressed reasonable assurance about this indicator.
(1)See subparagraph 4.3.1.4.1. GHG assessment: an annual exercise, Scope 3 – emissions estimated annually.
(2)“Operated” sites include all production sites (factories, distribution centres) as well as administrative sites and research centres. The reporting only includes sites with more than 50 people, as specified in the methodological notes (paragraph 4.5.1.3)
(3)Data restated according to the rules specified in the methodological notes (see paragraph 4.5.1.3).