
At administrative sites and research centres
The L’Oréal for the Future programme aims for a 40% reduction in energy consumption by 2030 at administrative sites and research centres per 100 hours worked compared with 2019.
In 2022, total energy consumption at the administrative sites and research centres was 162,914 megawatt-hours, a decrease of 14% in absolute value compared with 2019. The total energy consumption at the administrative sites and research centres was 354 kilowatt-hours per 100 hours worked, a 34% increase compared with 2019 (-34% compared with 2021).
Changes in energy consumption intensity (in relation to the number of hours worked on site) have been significantly affected by changes in work organisation. Indeed, since the lockdown periods (still in place in China for several months of 2022), the on-site attendance rate has fallen sharply due to the extensive use of remote working. Moreover, industrial pilot, laboratory and pre-launch testing(1) activities, which are more related to research and development projects and new product launches, consume a lot of energy regardless of the number of employees present. A minimum energy requirement is also essential for the operation of buildings and technical facilities.

This diagram shows the administrative sites and research centres.
From 2016 to 2022: + 18%
From 2019 to 2022: + 34%
L’Oréal pour le Futur - Target 2030: - 40%
(in kilowatt-hours per 100 hours worked)

Total energy consumption of administrative sites and research centres in kilowatt-hours
This graph shows the total energy consumption of administrative sites and research centres in kilowatt-hours.
In millions of kilowatt-hours
2017: approximately 280
2018: approximately 209
2019: approximately 210
2020: approximately 150
2021: approximately 160
2022: 163
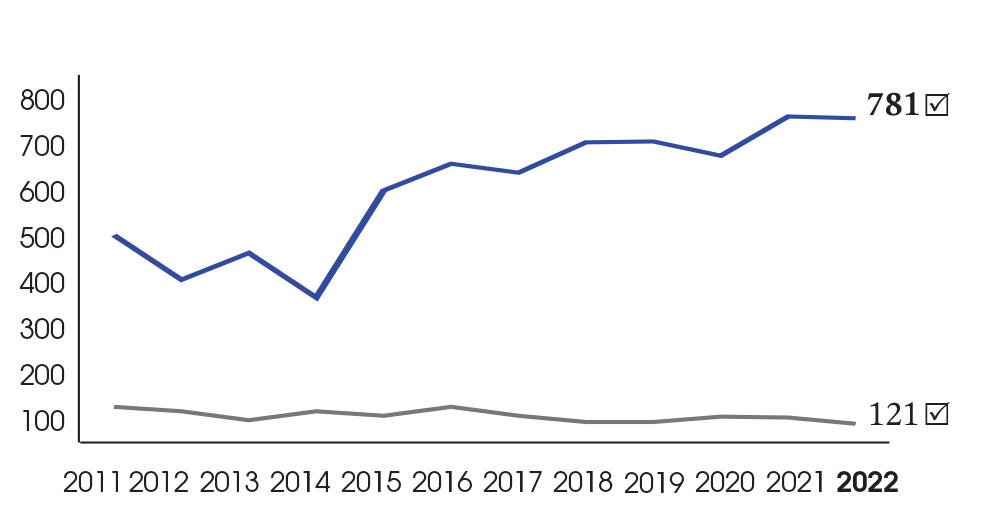
In kilowatt-hours per 100 hours worked
2017: approximately 280
2018: approximately 279
2019: approximately 275
2020: approximately 418
2021: approximately 492
2022: 354
![]() In millions of kilowatt-hours
In millions of kilowatt-hours
![]() In kilowatt-hours per 100 hours worked
In kilowatt-hours per 100 hours worked
Data on consumption with an impact on climate change
| Administrative sites | Industrial sites | Total operated sites | ||||
|---|---|---|---|---|---|---|
| 2021 | 2022 | 2021 | 2022 | 2021 | 2022 | |
| Renewable electricity (MWh) | 109,105 | 111,751 | 391,794 | 402,706 ☑ | 500,899 | 514,457 |
| Biogas (MWh) | 22,720 | 20,209 | 166,611 | 203,312 ☑ | 189,331 | 223,521 |
| Other renewable energies (MWh)(1) | 10,971 | 17,916 | 68,307 | 86,402 | 79,278 | 104,318 |
| Total renewable energy consumption (MWh) | 142,796 | 149,876 | 626,712 | 692,420 ☑ | 769,508 | 842,296 |
| Non-renewable electricity (MWh) | 8,651 | 5,485 | 12,450 | 10,977 ☑ | 21,101 | 16,462 |
| Gas (MWh) | 2,126 | 1,110 | 122,797 | 69,609 ☑ | 124,923 | 70,719 |
| Fuel (MWh) | 151 | 184 | 5,888 | 6,696 ☑ | 6,039 | 6,880 |
| Non-renewable heat, cooling and steam networks (MWh) | 17,856 | 6,259 | 14,086 | 1,763 | 31,942 | 8,022 |
| Total non-renewable energy (MWh) | 28,784 | 13,038 | 155,221 | 89,045 ☑ | 184,005 | 102,083 |
| TOTAL ENERGY CONSUMPTION (MWH) | 171,580 | 162,914 | 781,933 | 781,465 ☑ | 953,513 | 944,379 |
☑ The Statutory Auditors have expressed reasonable assurance with regard to this indicator.
(1) Biomass including wood and wood waste; renewable heat, cooling, and steam networks; solar thermal energy; biofuels.
(1) An entity reporting to R&I, tasked with producing limited quantities of bulk products or finished products (which cannot be marketed) to make them available to laboratories or business, and to help validate product design quality.