L’Oréal in figures
The Group closed the decade with its best year of like-for-like sales growth since 2007. Its operating margin reached a record high. The strength of L’Oréal’s well-balanced business model enabled the Group to keep on achieving profitable and sustainable growth, while again strengthening its position as the beauty market leader.

1st
cosmetics Group worldwide
88,000
employees
150
countries
36
brands
497
patents registered in 2019
Our performance
L’Oréal’s balanced business model enables the construction of long-term profitable growth.
€29.87 Bn
sales in 2019
+8.0%
like-for-like sales growth
Breakdown of 2019 sales (as %)
Divisions
-
Consumer Products
42.7% -
L'Oréal Luxe
36.9% -
Professional Products
11.5% -
Active Cosmetics
8.9%
Geographic Zones
-
Western Europe
27.7% -
North America
25.3% -
New markets 47.0%
-
Asia Pacific
32.3% -
Eastern Europe
6.4% -
Latin America
6.0% -
Africa, Middle East
2.3%
-
Business segments
-
Skincare and sun protection
35.0% -
Makeup
26.3% -
Haircare
14.9% -
Hair colouring
10.1% -
Fragrances
9.3% -
Other
4.4%
Weight of digital in sales
€4.6 Bn
of sales in e-commerce
15.6%
of consolidated sales in e-commerce
+52.4%
like-for-like growth in e-commerce sales in 2019
Consolidated sales (in million of euros)
+8.0%
2019 growth
- 19,496 € million
- 20,343 € million
- 21,638 € million
- 22,124 € million
- 22,532 € million
- 25,257 € million
- 25,837 € million
- 26,024 € million
- 26,937 € million
- 29,873 € million
Our profits
€5.54 Bn
operating profit
+10.4%
increase in dividend per share
Operating profit (in million of euros)
+12.7%
growth in operating profit
- 3,057 € million
- 3,293 € million
- 3,558 € million
- 3,760 € million
- 3,891 € million
- 4,388 € million
- 4,540 € million
- 4,676 € million
- 4,922 € million
- 5,547 € million
Record operating margin at 18.6% of sales (in %)
- 18.6% %
- 18.3% %
- 18.0% %
- 17.6% %
- 17.4% %
Net profit excluding non-recurring items after non-controlling interests (in million of euros)
+9.3%
Growth in net profit excluding non-recurring items after non-controlling interests
- 2,371 € million
- 2,583 € million
- 2,861 € million
- 3,032 € million
- 3,125 € million
- 3,490 € million
- 3,647 € million
- 3,749 € million
- 3,988 € million
- 4,356 € million
Earnings per share (in €)
+9.3%
increase in earnings per share in 2019
| Years |
Earnings per share (in €) |
|---|---|
| 2010 | 4.01 |
| 2011 | 4.32 |
| 2012 | 4.73 |
| 2013 | 4.99 |
| 2014 | 5.34 |
| 2015 | 6.18 |
| 2016 | 6.46 |
| 2017 | 6.65 |
| 2018 | 7.08 |
| 2019 | 7.74 |
Balanced operating profitability
Total Divisions
Profitability by Division
(as % of Division sales)
| Division | Profitabilité en % |
|---|---|
|
Professional Products |
20.1% |
|
Consumer Products |
20.2% |
|
L'Oréal Luxe |
22.6% |
|
Active Cosmetics |
23.3% |
A solid financial situation at 31 December 2019
Net cash surplus
2,399
million euros
Short-term ratings
-
A1+
Standard & Poor's
-
Prime 1
Moody's
-
F1+
Fitch Ratings
Capital expenditure
4.1%
of sales
A dynamic shareholder return policy
10.4%
Increase of dividend in 2019
€4.67
Preferential dividend of +10% for shareholders holding registered shares
- DIVIDEND PER SHARE (in euros)
- PREFERENTIAL DIVIDEND (in euros)
- 4.25 4.67
- 3.85 4.23
- 3.55 3.90
- 3.30 3.63
- 3.10 3.41
- 2.70 2.97
- 2.50 2.75
- 2.30 2.53
- 2.00 2.20
- 1.80 NA
| Years | DIVIDEND PER SHARE (in euros) | PREFERENTIAL DIVIDEND (in euros) |
|---|---|---|
| 2019 | 4.25€ | 4.67€ |
| 2018 | 3.85€ | 4.23€ |
| 2017 | 3.55€ | 3.90€ |
| 2016 | 3.30€ | 3.63€ |
| 2015 | 3.10€ | 3.41€ |
| 2014 | 2.70€ | 2.97€ |
| 2013 | 2.50€ | 2.75€ |
| 2012 | 2.30€ | 2.53€ |
| 2011 | 2.00€ | 2.20€ |
| 2010 | 1.80€ | 1.80€ |
Pay-out ratio (as % of profit)
54.9%
pay-out ratio as a % of profit
| Years |
Pay-out ratio (as % of profit) |
|---|---|
| 2010 | 44.9% |
| 2011 | 46.3% |
| 2012 | 46,8% |
| 2013 | 48.7% |
| 2014 | 50.6% |
| 2015 | 50.2% |
| 2016 | 51.1% |
| 2017 | 53.4% |
| 2018 | 54.4% |
| 2019 | 54.9% |
-
€264.00
share price at 31 December 2019
-
€147.3 Bn
market capitalisation
Our "Sharing Beauty With All" indicators
The aim of the sustainable transformation programme “Sharing Beauty With All”, launched in 2013, is to make L’Oréal a model company in terms of sustainable innovation, production, consumption, and in sharing its growth with all Group stakeholders.
85%
of new or renewed products launched in 2019 have an improved social or environmental profile
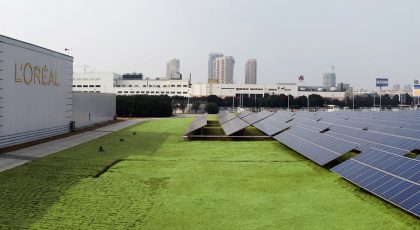
-78%
reduction in CO2 emissions in absolute terms in plants and distribution centres since 2005
-51%
reduction in water consumption in plants and distribution centres since 2005
-35%
reduction of waste generated in plants and distribution centres since 2005
3 A
ratings from CDP for reducing carbon emissions, managing water sustainably and protecting forests in the supply chain
89%
of brands have assessed their environmental and social impact
90,635
people from socially or economically disadvantaged communities gained access to employment
87%
of the Group’s strategic suppliers have been assessed and selected on the basis of their environmental and social performance
94%
of the Group’s permanent employees benefit from health cover that reflects best practices in their country of residence


